http://icecap.us/images/uploads/don3.JPG
https://climateaudit.files.wordpress.co ... terium.png
https://i1.wp.com/d3a5ak6v9sb99l.cloudf ... .large.jpg
The Science and the Politics of Climate Change
Moderatori: erboss, MeteoLive, jackfrost
Sunspot number attivita' Solare e temperature Globali .
" This paper deals with the analysis of global temperatures and sunspot numbers and the relationship between the two. We use techniques based on the concept of long range dependence. For the temperatures, the best specification seems to be a fractionally integrated or I(d) model with an order of integration d of about 0.46 and an estimated time trend coefficient that suggests that temperatures have increased by about 0.57 °C over the last one hundred years. However, for the sunspot numbers, a cyclical fractional model seems to be more appropriate, with a periodicity of 11 years per cycle and an order of integration of about 0.40. Thus, the two series display long memory and fractional integration. However, the fact that both series display poles in the spectrum at different frequencies implies that we fail to reject the null hypothesis of no relationship between the two variables in the long run. Moreover, assuming that the sunspots are exogenous, the results show no statistical significance of this variable on the global temperatures, which is one of the main contributions of the present work."
" This paper deals with the analysis of global temperatures and sunspot numbers and the relationship between the two. We use techniques based on the concept of long range dependence. For the temperatures, the best specification seems to be a fractionally integrated or I(d) model with an order of integration d of about 0.46 and an estimated time trend coefficient that suggests that temperatures have increased by about 0.57 °C over the last one hundred years. However, for the sunspot numbers, a cyclical fractional model seems to be more appropriate, with a periodicity of 11 years per cycle and an order of integration of about 0.40. Thus, the two series display long memory and fractional integration. However, the fact that both series display poles in the spectrum at different frequencies implies that we fail to reject the null hypothesis of no relationship between the two variables in the long run. Moreover, assuming that the sunspots are exogenous, the results show no statistical significance of this variable on the global temperatures, which is one of the main contributions of the present work."
-
the hurricane

- Messaggi: 2470
- Iscritto il: mar feb 01, 2011 10:34 am
- Località: Caravaggio (BG)
Quindi, traducendo per comuni mortali non è stata trovata una correlazione significativa tra il SSN e le temperature globali visto che sono state trovate due frequenze diverse.robert ha scritto:Sunspot number attivita' Solare e temperature Globali .
" This paper deals with the analysis of global temperatures and sunspot numbers and the relationship between the two. We use techniques based on the concept of long range dependence. For the temperatures, the best specification seems to be a fractionally integrated or I(d) model with an order of integration d of about 0.46 and an estimated time trend coefficient that suggests that temperatures have increased by about 0.57 °C over the last one hundred years. However, for the sunspot numbers, a cyclical fractional model seems to be more appropriate, with a periodicity of 11 years per cycle and an order of integration of about 0.40. Thus, the two series display long memory and fractional integration. However, the fact that both series display poles in the spectrum at different frequencies implies that we fail to reject the null hypothesis of no relationship between the two variables in the long run. Moreover, assuming that the sunspots are exogenous, the results show no statistical significance of this variable on the global temperatures, which is one of the main contributions of the present work."
Certamente durante il XX secolo contributo Antropico rilevante ,the hurricane ha scritto:Quindi, traducendo per comuni mortali non è stata trovata una correlazione significativa tra il SSN e le temperature globali visto che sono state trovate due frequenze diverse.robert ha scritto:Sunspot number attivita' Solare e temperature Globali .
" This paper deals with the analysis of global temperatures and sunspot numbers and the relationship between the two. We use techniques based on the concept of long range dependence. For the temperatures, the best specification seems to be a fractionally integrated or I(d) model with an order of integration d of about 0.46 and an estimated time trend coefficient that suggests that temperatures have increased by about 0.57 °C over the last one hundred years. However, for the sunspot numbers, a cyclical fractional model seems to be more appropriate, with a periodicity of 11 years per cycle and an order of integration of about 0.40. Thus, the two series display long memory and fractional integration. However, the fact that both series display poles in the spectrum at different frequencies implies that we fail to reject the null hypothesis of no relationship between the two variables in the long run. Moreover, assuming that the sunspots are exogenous, the results show no statistical significance of this variable on the global temperatures, which is one of the main contributions of the present work."
ma lo e' stato anche l attvita Solare durante il XX secolo,
http://i191.photobucket.com/albums/z36/ ... tCount.jpg
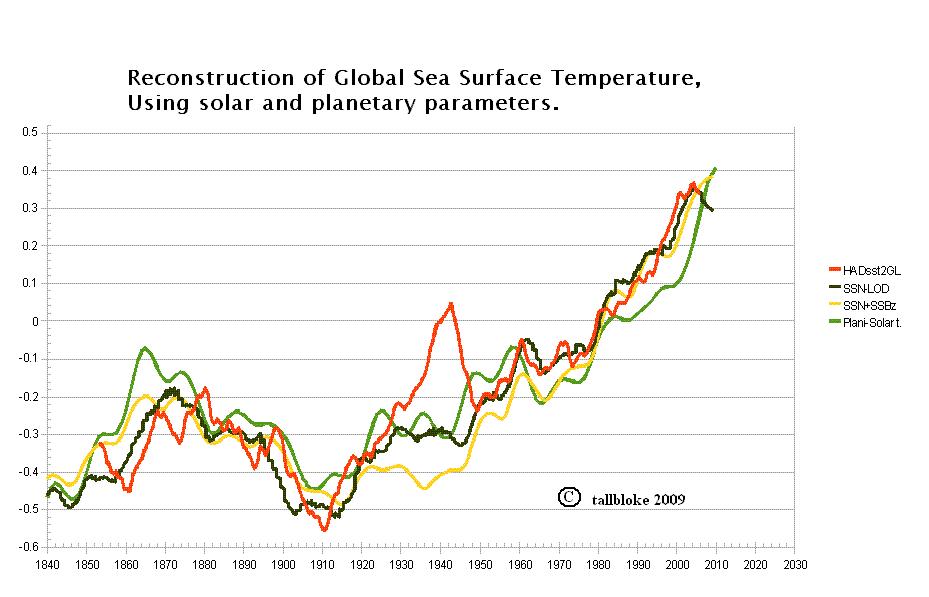
ci sono studi che dimostrano anche una forte correlazione tra Sunspot Number attivita Solare e temperature Globali .
http://www.seafriends.org.nz/issues/global/global37.gif
https://tallbloke.files.wordpress.com/2 ... rature.jpg
http://oi45.tinypic.com/8wxt1e.jpg
http://www.climate4you.com/images/Solar ... ce1610.gif
http://www.climate4you.com/images/HadCR ... ce1850.gif
periodo XX secolo in cui c'e stata alta attivita Solare
http://c3headlines.typepad.com/.a/6a010 ... fc0970c-pi
http://c3headlines.typepad.com/.a/6a010 ... d35970c-pi
https://tallbloke.files.wordpress.com/2 ... abreu2.png
https://nextgrandminimum.files.wordpres ... jpeg?w=900
https://nextgrandminimum.files.wordpres ... .jpg?w=900
Le proiezione dell IPCC dicono che entro fine secolo la temperatura media globale potrebbe aumentare da un minimo di 1, 5 ad una massimo di 4, 8 C.
Secondo i dati satellitari in un ventennio , dal 1998 , la temperatura media e' aumentata di 0,2 decimo di grado , nel contempo e' aumentata la CO2 ,
probabilemnte sono altri fattori che possono interagire ed influire sul trend Climatico.
In contesto Minimo Solare simil Dalton in futuro potrebbero prevalere fasi NIna e NIna strong ,
dal 1940 al 2000 alta attivita' Solare , Grande Massimo Moderno
dal 1976 al 2016 maggiore numero di El Nino .
Il consumo dei combustibili fossili era gia evidente nella seconda meta' del 1800 , l economista William Stanley nel 1865 aveva notato come i consumi di carbone fossero incrementati nettamente dopo che James Watt aveva reso piu efficienti i motori a vapore.
Il 22 Aprile 1970 all Earth Day , la manifestazione Ambientale piu importante dell storia , negli States parteciparono oltre 20 milioni di persone , a New York oltre centomila persone per le strade per denunciare i rischi della crescita demografica , dell inquinamento ambientale . Mostrando come l ambientalismo fosse diventato un movimento di massa.
I tempi erano maturi perche il problema Ecologico entrasse nella agenda Internazionale.
Erano gli anni '70.
commenti di gennaio 2016 ,robert ha scritto:Si , BurianBurian2012 ha scritto:Robert cosa pensi invece del biennio 2017-2018?
Molto probabilmente si affermeranno condizioni favorevoli alla Nina con nuovo calo dell'indice solare che sta calando già da due anni dopo il massimo di 3 anni fa. Specialmente riguardo all'inverno 2016-17 che coinciderebbe con il nuovo minimo solare La Nina e QBO-!?
Con alta probabilita dopo un forte El Nino segue una fase Nina , esempio dopo El Nino tra il 1997e1998 . Nina piuttosto forte tra il 1998 e 2000 ,
Anche dopo El Nino 2009/2010 strong Nina tra il 2010 e 2011.
In contesto minimo Solare e QBO - EA negativa , tra il 2017 e 2019 probabile Inverno tra i piu freddi degli ultumi decenni.
Un po simile all inverno del 1963 , 1953 , 1965.
ma " attuali " tendenzialmente probabili nei prossimi inverni .
Climate sensitivity
" A global climate forcing, measured in W/m2
averaged over the planet, is an imposed
perturbation of the planet’s energy balance. Increase of solar irradiance (So) by 2% and
doubling of atmospheric CO2 are each forcings of about 4 W/m2
Charney defined an idealized climate sensitivity problem, asking how much global
surface temperature would increase if atmospheric CO2 were instantly doubled, assuming that
slowly-changing planetary surface conditions, such as ice sheets and forest cover, were fixed.
Long-lived GHGs, except for the specified CO2 change, were also fixed, not responding to
climate change. The Charney problem thus provides a measure of climate sensitivity including
only the effect of ‘fast’ feedback processes, such as changes of water vapor, clouds and sea ice.
Classification of climate change mechanisms into fast and slow feedbacks is useful, even
though time scales of these changes may overlap. We include as fast feedbacks aerosol changes,
e.g., of desert dust and marine dimethylsulfide, that occur in response to climate change .
Charney used climate models to estimate fast-feedback doubled CO2 sensitivity of 3 ±
1.5°C. Water vapor increase and sea ice decrease in response to global warming were both found
to be strong positive feedbacks, amplifying the surface temperature response. Climate models in
the current IPCC [2] assessment still agree with Charney’s estimate.
Climate models alone are unable to define climate sensitivity more precisely, because it is
difficult to prove that models realistically incorporate all feedback processes. The Earth’s
history, however, allows empirical inference of both fast feedback climate sensitivity and longterm
sensitivity to specified GHG change including the slow ice sheet feedback. "
I modelli Climatici hanno un certo grado di incertezza quindi non precisi , non contengono le molteplici Variabili e meccanismi che influiscono i cambiamenti climatici ,come le oscillazioni Naturali del Clima che sembrano fortemente correlate all' andamento dell attivita Solare e cicli Oceanici . Sistema Solare e movimenti dei Pianeti , fattori Astronomici .
Nel 1976 una conferma sperimentale alla Teoria dell' Astronomo Serbo Milankovich mediante esami di sedimenti organici Oceanici .
Successivamente esperimenti con i Modelli Climatici simulati con calcolatori della NASA hanno indicato che i cambiamenti dei paramentri Orbitali terrestri potrebbero effettivamente influire sui cambiamneti Climatici.
Successivamente esperimenti con i Modelli Climatici simulati con calcolatori della NASA hanno indicato che i cambiamenti dei paramentri Orbitali terrestri potrebbero effettivamente influire sui cambiamneti Climatici.
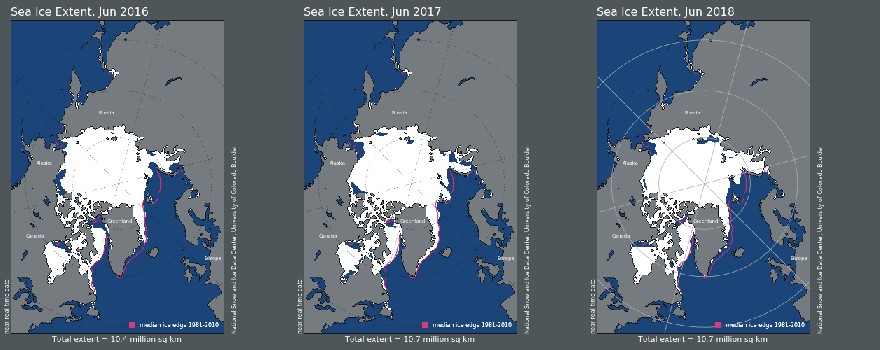
'Arctic sea ice has shown a record May-to-May growth from 2016 to 2017. It was the strongest growth for that period since measurements began in 1979.'
'Greenland’s ice mass so far is showing a surplus of some 700 billion tonnes – a record!'
http://www.climate4you.com/images/NHSea ... s-JUNE.jpg
'Greenland’s ice mass so far is showing a surplus of some 700 billion tonnes – a record!'
http://www.climate4you.com/images/NHSea ... s-JUNE.jpg
-
IMadeYouReadThis

- Forumista senior
- Messaggi: 7113
- Iscritto il: gio lug 07, 2016 9:02 pm
- Località: Trento (195m)
robert ha scritto:'Arctic sea ice has shown a record May-to-May growth from 2016 to 2017. It was the strongest growth for that period since measurements began in 1979.'
'Greenland’s ice mass so far is showing a surplus of some 700 billion tonnes – a record!'
http://www.climate4you.com/images/NHSea ... s-JUNE.jpg

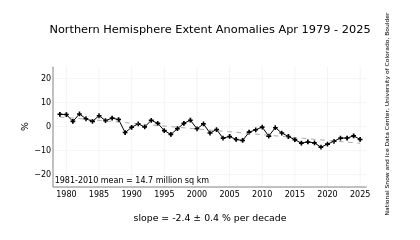
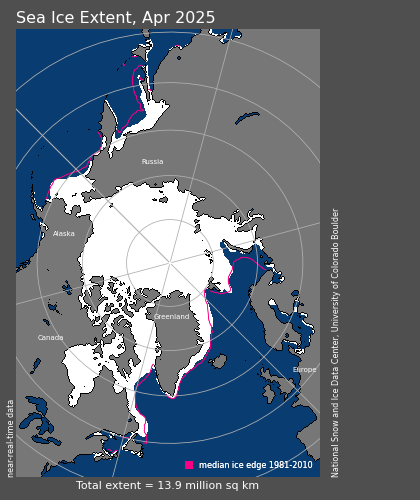
E' peggiorata un tantino la situazione da giugno...
dal 2016 e' incrementato l estensione dei ghiacciai Artici ,IMadeYouReadThis ha scritto:robert ha scritto:'Arctic sea ice has shown a record May-to-May growth from 2016 to 2017. It was the strongest growth for that period since measurements began in 1979.'
'Greenland’s ice mass so far is showing a surplus of some 700 billion tonnes – a record!'
http://www.climate4you.com/images/NHSea ... s-JUNE.jpg
E' peggiorata un tantino la situazione da giugno...
http://nsidc.org/data/seaice_index/images/n_plot.png
http://nsidc.org/data/seaice_index/images/n_extn.png
“In the past 500 years, Greenland temperatures have fluctuated back and forth between warming and cooling about 40 times, with changes every 25–30 years. … Comparisons of the intensity and magnitude of past warming and cooling climate changes show that the global warming experienced during the past century pales into insignificance when compared to the magnitude of profound climate reversals over the past 25,000 years. At least three warming events were 20–24 times the magnitude of warming over the past century, and four were 6–9 times the magnitude of warming over the past century.”
Usi tanti di quei "probabilmente" quando fai accenni a AGW , Co2 e fattore antropico, da restar sconcertati. Altrettanti non ne usi quando parli d'inverni futuri , di freddi prossimi, di Nina che perlatro non si vede manco col telescopio, che la tua obbiettivita' al riguardo del tema climatico mi lascia ....senza parole. Ma sul serio pensi robe del genere? Pensi che tutto dipenda da che cosa , intendo a maggior ragione? Dall'attivita' solare? Orbene senza tante chiacchiere , come spieghi che essendo al minimo da diversi anni, si son visti quest'ultimi tra i piu' caldi da 200/250 anni a questa? Non farmi la conosciutissima storiella degli accumuli oceanici, perche' non tiene fa' acqua da ogni dove; in primis non cè' nessun surplus dell'Atlantico , se vogliamo per iniziare, perche' sai bene o dovresti che, c'è un bel "Blob" sul medio alto da un bel po' di tempo. Forse proprio secondo gli scienziati che nomini dovuto allo scioglimento di ghiacci groenlandesi e del Polo che raffredderebbero l'Atlantico rendendo la porzione medio alta piu' fredda, tant'è che probabilm. la C.d.G. ha deviato proprio a questa causa. Quindi escluderei. Estati, se vogliamo prendere solo queste stagioni ma sosterrei con onor di causa ANNATE che sono tra le piu' calde in assoluto, saprai il concetto d'assoluto no? Quindi....attivita' solare..? Naa......
casomai altri fattori astronomici, come precessione dell'asse ma non certo l'attivita'. Stagioni si diceva calde, tra le ++ importanti viste tra l'ultimo decennio dell'old millenium e questo....debbo citarle? Non penso occorra.. e quindi? Cos'è a tuo parere che ti fa' ancora usare l'avverbio di DUBBIO, "PROBABILMENTE" quando si parla di contributi dell'uomo, d'altro che non sia da Natural Factors, visto che tutto il sopracitato va' piu' in esclusione che a suffragio delle tue tesi? No, domando..
Che cos'è che c'ha fatto fare un balzo ENORME verso : caldi eccessivi per le annate intere e x di piu', per l'emisfero Boreale molto piu' popolato (gurda caso..) e piu' industrializzato / inverni-non inverni, sempre miti e soprat. pochissimo piovosi, lascerei cadere un pietoso velo su faccende come il 2012 in febbraio, quest'anno all'Epifania, perche' sei sei un vero expert di statistiche, senza dubbio alcuno saprai che una settimana, una decina di gg. e ROBE simili, non fanno certo...un Inverno! Quindi non scherzerei neppure su questo...tasto. Gli inverni, quelli d'un "tempo" com'erano, mancano e lo SAI molto, ma MOLTO bene secondo me. Solo che quell'avverbio, cosi' in uso...
Non c'è all'orizzonte alcun trend nuovo indirizzato al freddo, e dovresti scusami averlo capito anche te che lo proponi da tempo. Forse si farebbe molto prima a procurarsi un biglietto per il cinema, per il prossimo gran MOVIE "american-style" sul tema tipo, APOCALYPSE COLD, o THE BIG ICE AGE. secondo me , si fa' prima che a continuare a sognarselo un nuovo trend al freddo. D'altronde lo si sogna gia' da quando...?